
- 6 February 2023
- Sarah Clarke
- Business Skills
Tracking & Analysing Costs
Understanding & challenging costs is more important more than ever. Businesses have data that can help.
This blog describes how to put that data to work. It covers four essential disciplines.
- Knowing what tasks your costs are funding
- Discovering what drives your costs and where the value is
- Challenging all your costs to expose the essentials
- Spending in ways that helps profitability
Knowing what tasks your costs are funding
It’s easy enough to make your costs visible. Any Finance System will provide an extract of transactions – dates, account codes and the amounts involved.
But a list of transactions doesn’t tell you very much. Yes, you can see what you have purchased (including what is probably the largest cost – salaries). But it’s not easy to see what the tasks are that those costs are funding – essential if you are to challenge your costs and search for ways to minimise them.
Your costs will fall broadly into four categories, as illustrated by the four layered triangle below. The costs positioned in the bottom layer fund tasks that relate directly to services to the customer. You can expect these to increase whenever you receive an order, for example.
Those in the ‘supporting tasks’ layer fund tasks that support what’s happening with the customer. They will show, for example, an uptick whenever a new customer arrives. (E.g. the cost of setting the customer up in a CRM system).
The top two layers fund tasks that sustain the future (e.g. marketing) and ensure that your business continues to operate legally (e.g. preparing the accounts). These are costs that are decision based i.e. you might choose to pay for a social media campaign whereas you may have no choice about the need to procure systems for handling customer orders.
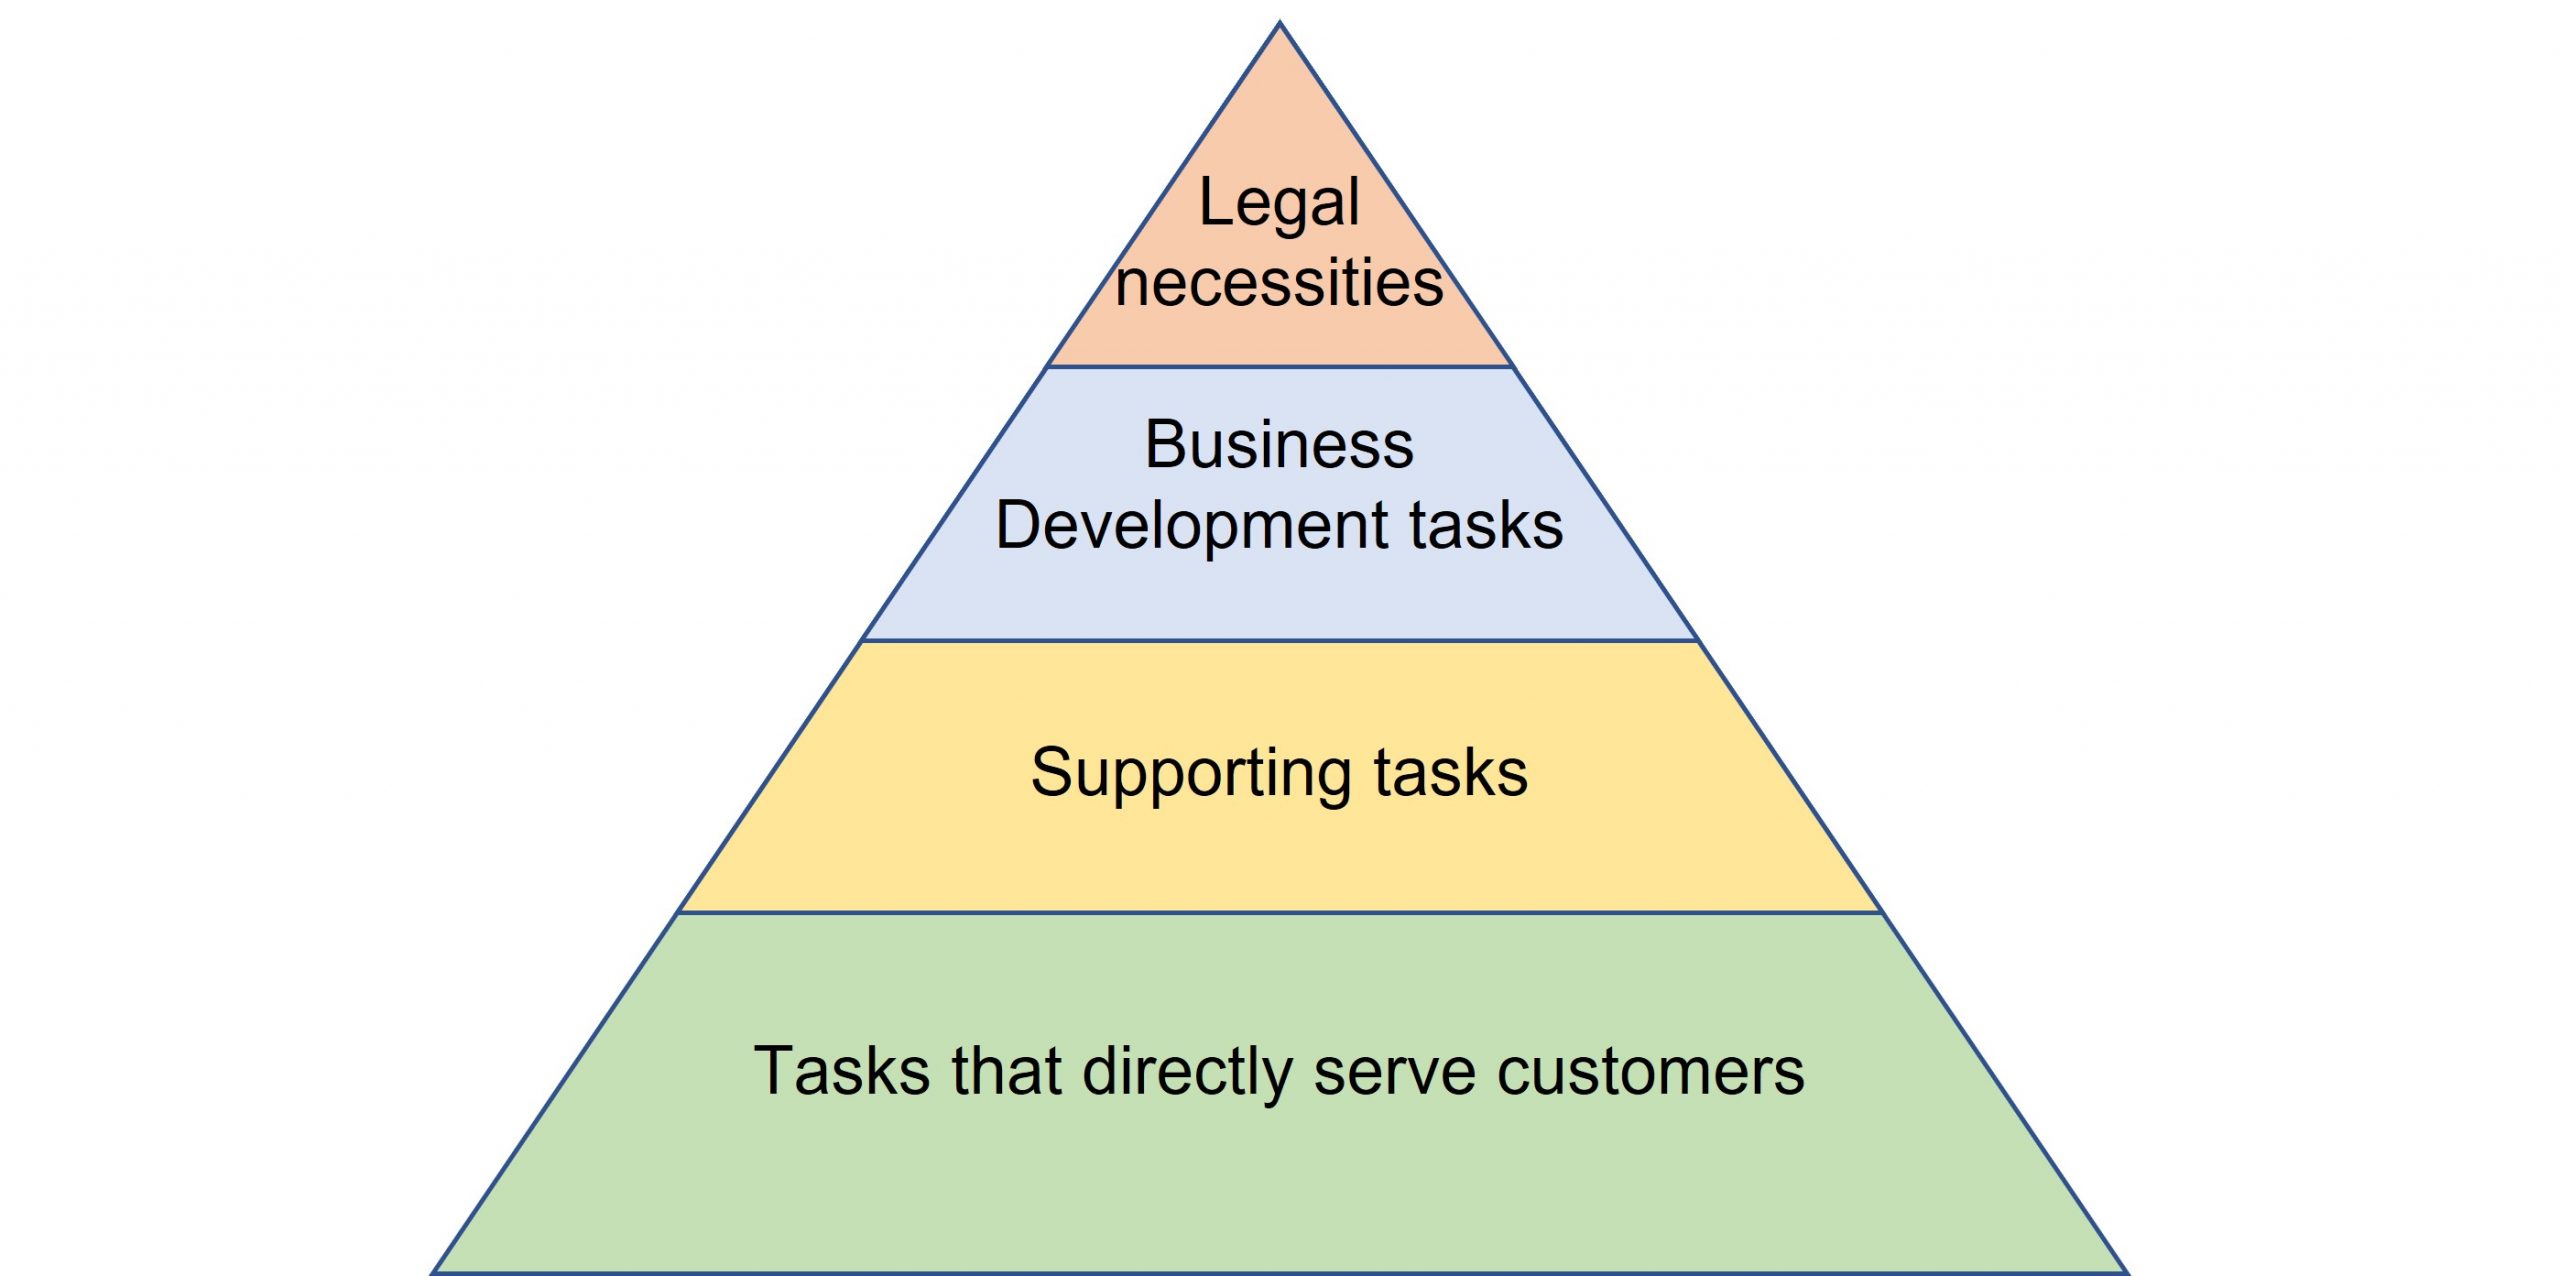
The triangle above depicts the cost of working directly with the customer as being larger than the layers above. But this might not be the case. Technology businesses for example, in particular those engaged in a great deal of research and development, might see a triangle that is almost inverted. The cost of building the technology needed to develop tomorrow’s business may dwarf everything else.
We now want to understand how much our costs change whenever an event happens. For example, in the figure below we imagine a new customer coming onboard, an order received, an order cancelled, and an order changed – and the cost incurred each time one of these events takes place.
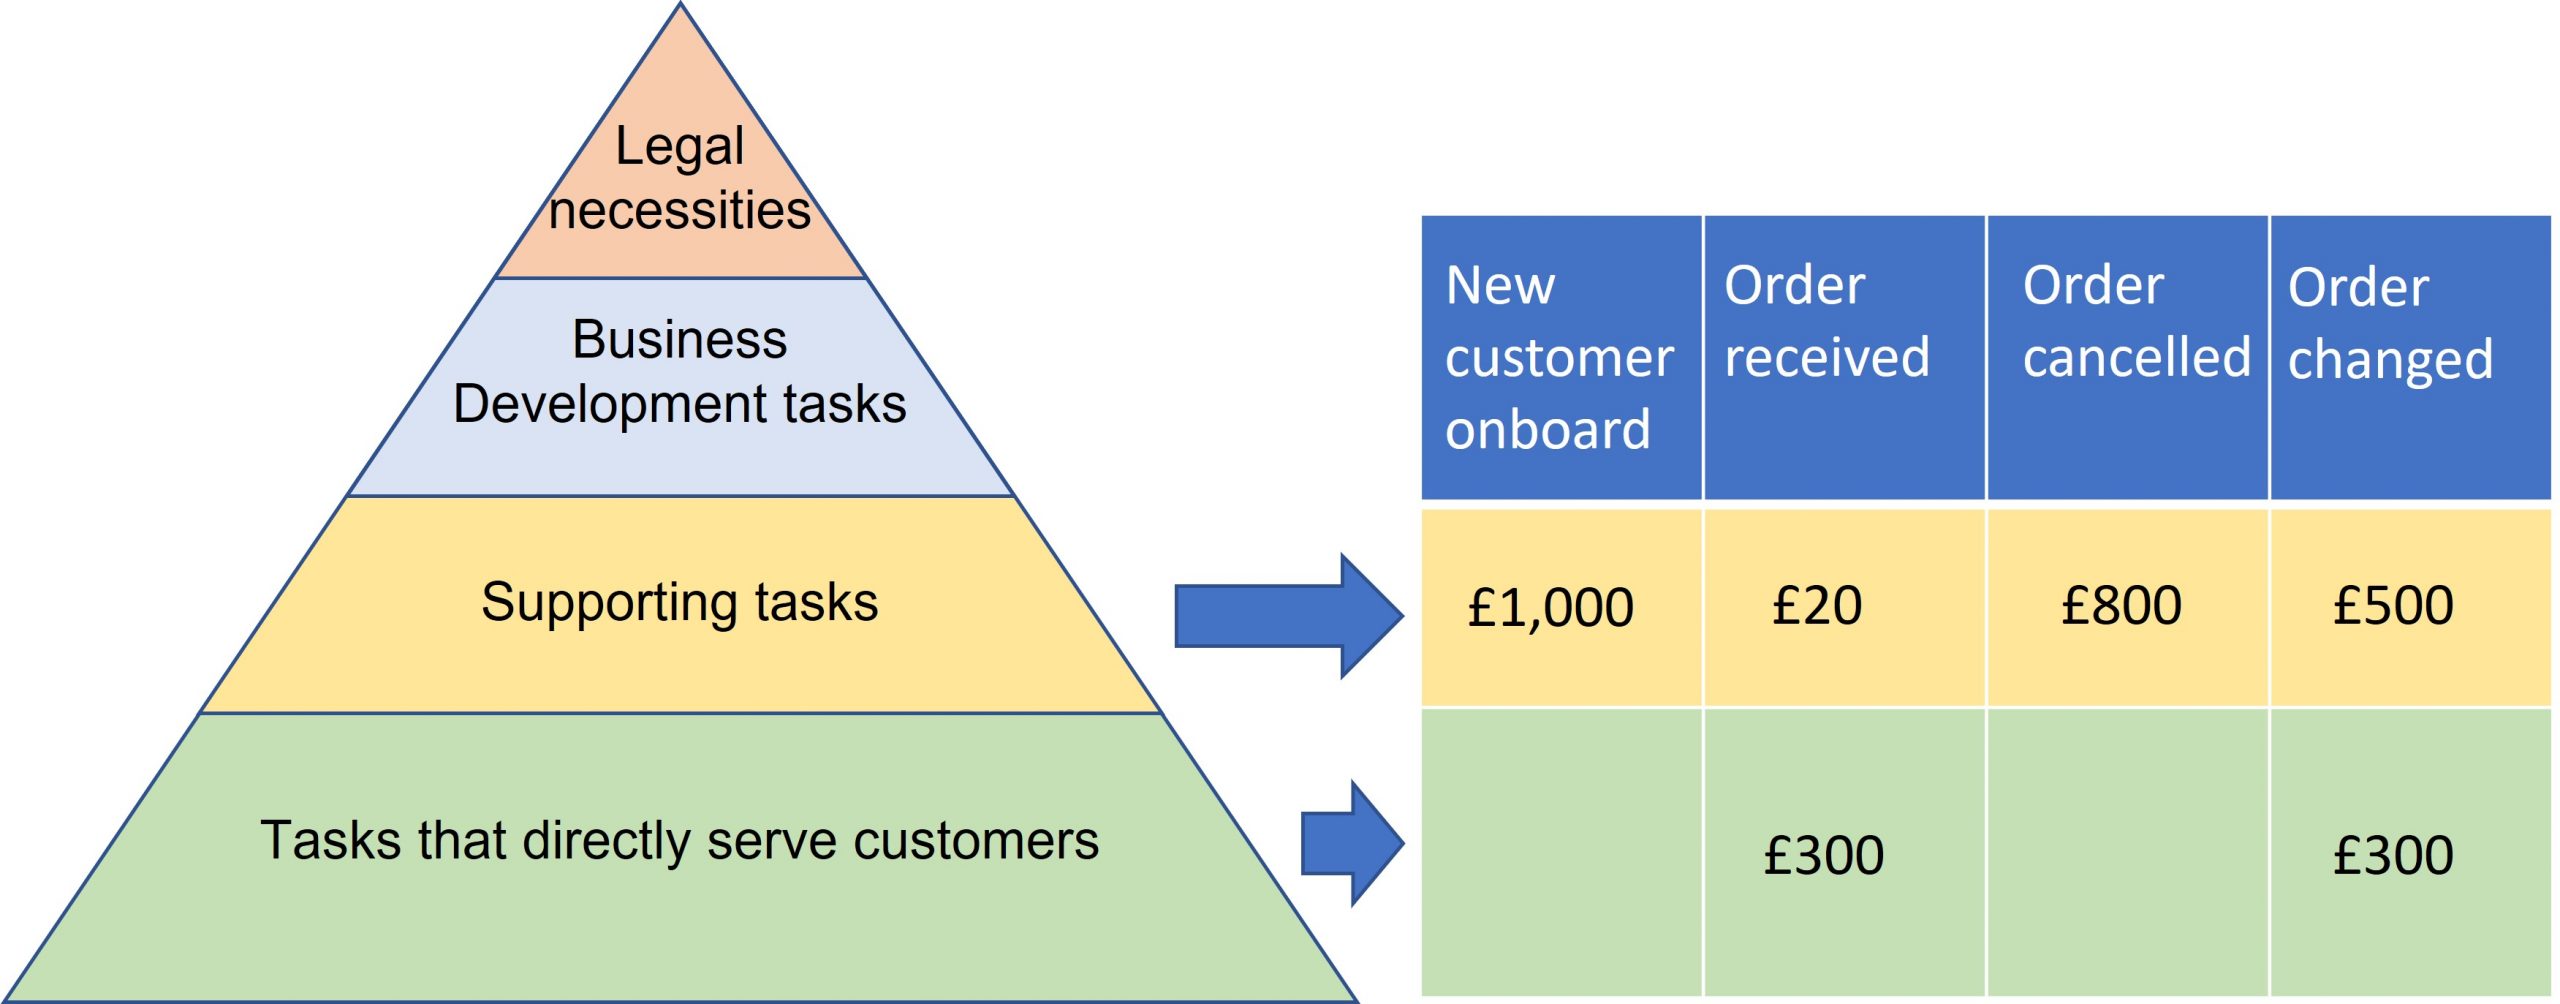
Once the cost of an event is known, it is possible to then take a close look at the factors that drive the cost of the event.
However, there are some key questions that have to be answered first:
- How do you allocate costs in this way?
- Do you need to calculate a cost for every task?
- Is the result accurate enough to be of use?
Discovering what drives your costs
The allocation of costs to tasks starts with the questions about cost that you would most like to answer e.g. how much does it cost to deliver an urgent order, or to recruit a member of staff?
You then use a tool such as an on-line whiteboard to map the steps involved e.g. when you receive an order, or you opt to recruit a new member of staff.
But keep it simple. E.g. your whole process from receipt of an order through to delivery might be listed using just a few steps – along with the key supporting steps involved. The flow below gives you an idea of the granularity required.
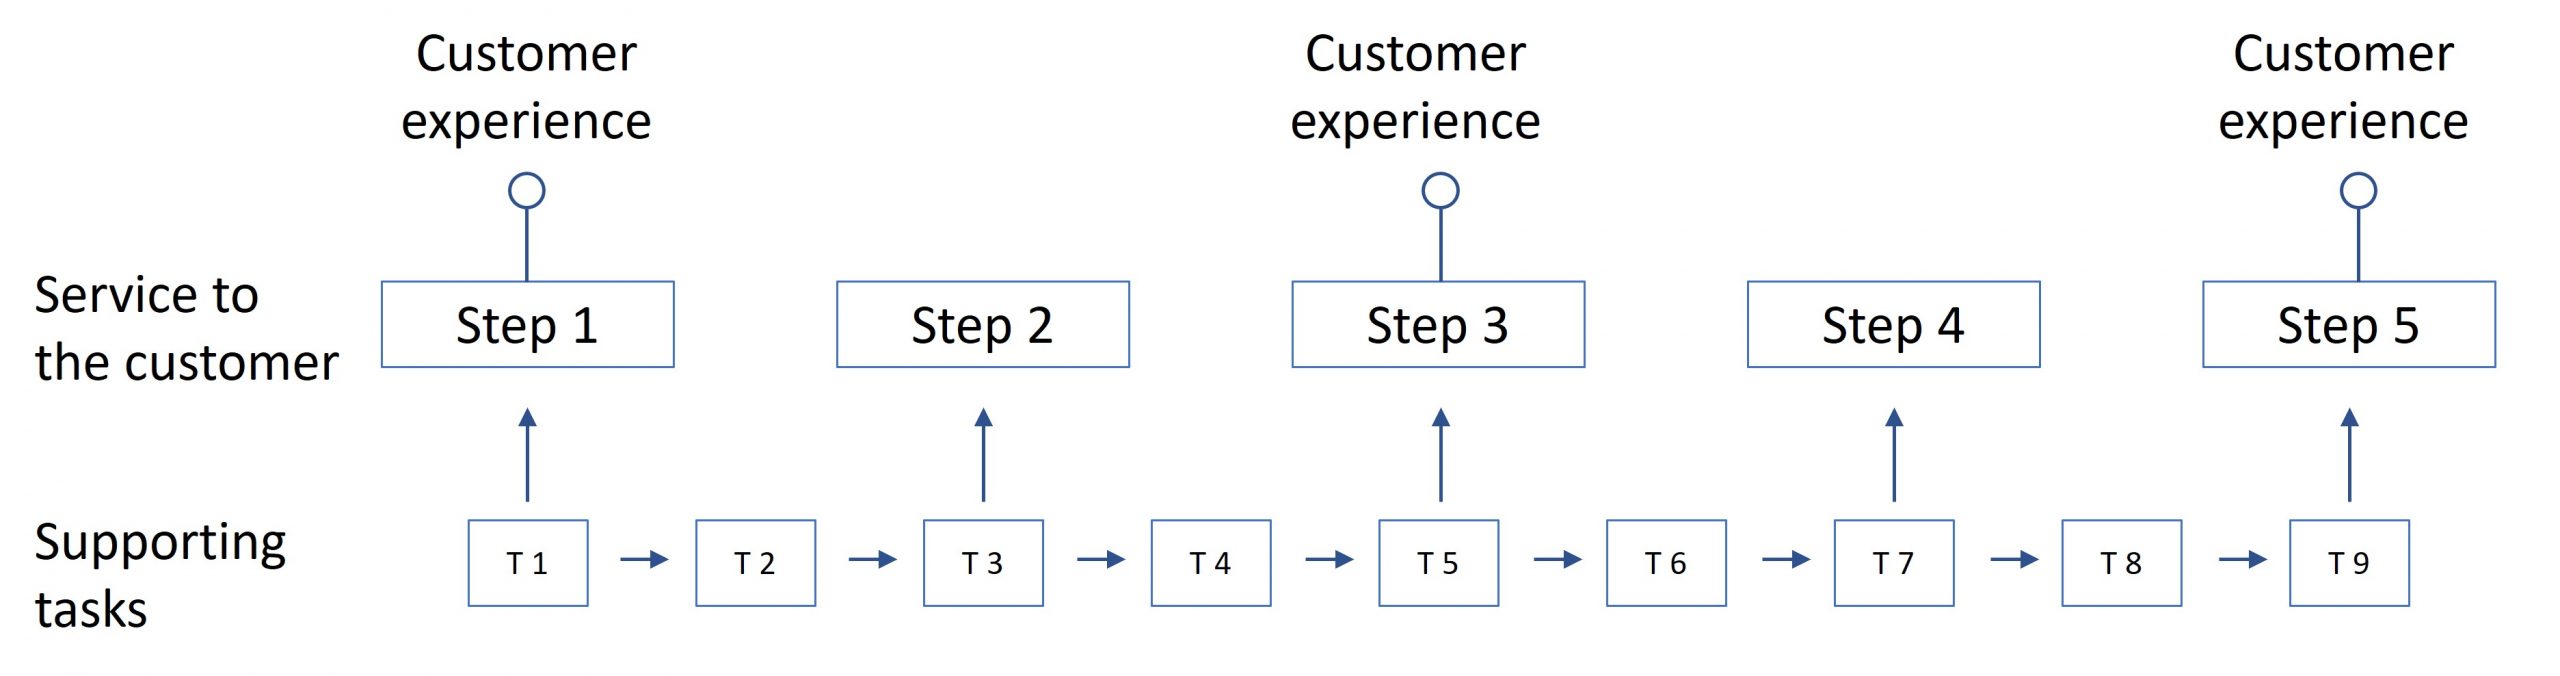
With a simple process flow in place, you will now have enough to populate a spreadsheet needed for the allocation step.
You paste into a column the major account items (e.g. salaries, IT support costs). In an adjoining column you add the transaction totals for a period e.g. the last quarter.
You then create a matrix by pasting the steps from your process flow into a row so that each step becomes a column header.
Starting with the largest cost, you allocate it to one or more of the steps that it helps to fund. E.g. the Salary Cost line item might be allocated according to the hours involved in each step in a typical week or month. Transport costs might be allocated to just the step involved in order fulfilment.
Each allocation is, of course, simply an estimate. But the point of the exercise is to steadily build up the cost associated with each of the steps to the point at which you can recognise that the cost of, say, a cancelled order is in the order of £800 and not £80 – and the cost of a member of staff leaving, followed by the subsequent cost of recruiting their replacement, dwarfs the cost of the pay rise that might have persuaded them to stay.
Challenging costs to expose the essentials
The nature of the next step depends upon your feel for the way that the underlying tasks are performed. Things might be working well, but they involve manual operations that will have attracted a significant proportion of the salary cost.
Or there is already automation in place, but unplanned work (e.g. rework, chasing, waiting) keeps appearing that has to be sorted out manually.
Or there might be some sizeable non-staff expenses that need to be exposed and challenged.
Whatever your circumstances, you and your team are challenging the need for cost – which is exactly what this exercise is all about.
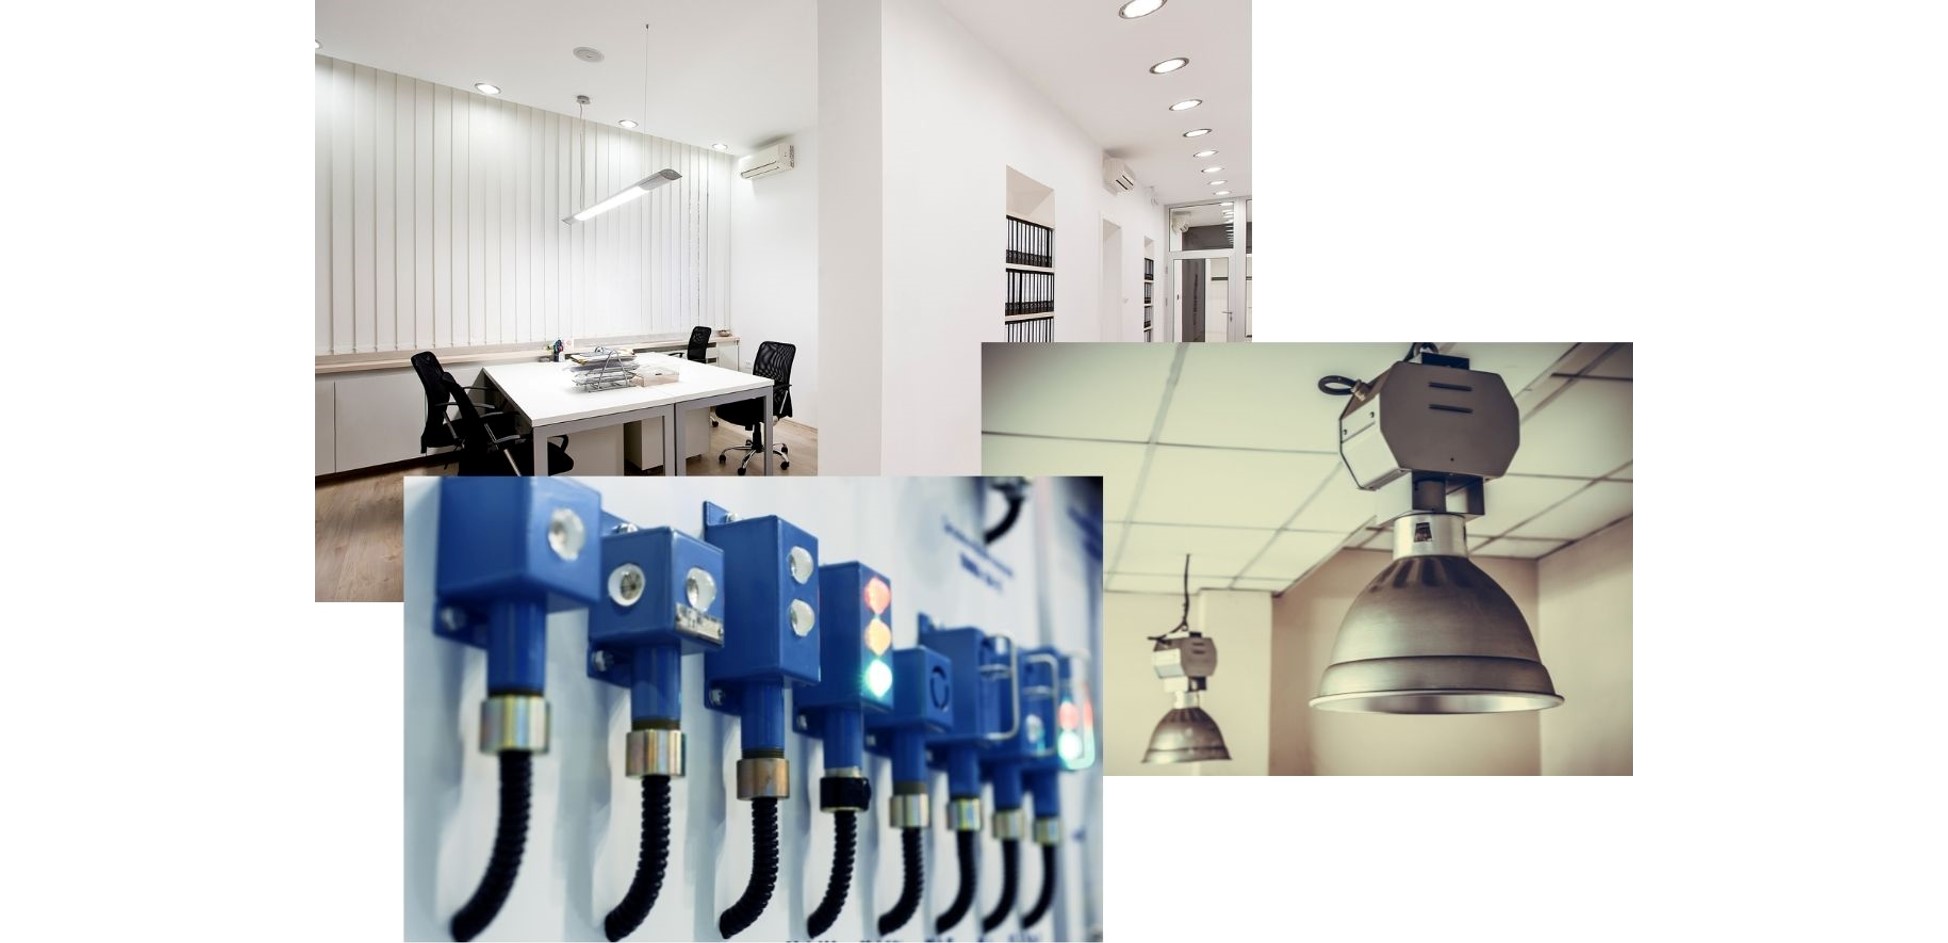
As an example of how this process can bring much needed visibility to costs, we supported an Electrical Contracting company that installs electrical systems into commercial buildings. Most of the time they sub-contract their services to larger contractors who might, for example, be building a new factory or office block.
They have several high level performance metrics, however two were problematic:
- The number of projects delivered on time – target 90%, actual performance 65%
- The average margin made on contracts – target 25%, actual performance 12%
Their operations were still very much paper based, and it was known that this was hampering the efficiency with which things could work.
Simple process maps were developed that reflected how services were delivered to the customer. The time spent on each step was estimated, and underlying delays and inefficiencies were noted.
When all the data was plotted, it was clear how much time was consumed by manual input, delays and rework, and how large the ensuing burden on costs turned out to be.
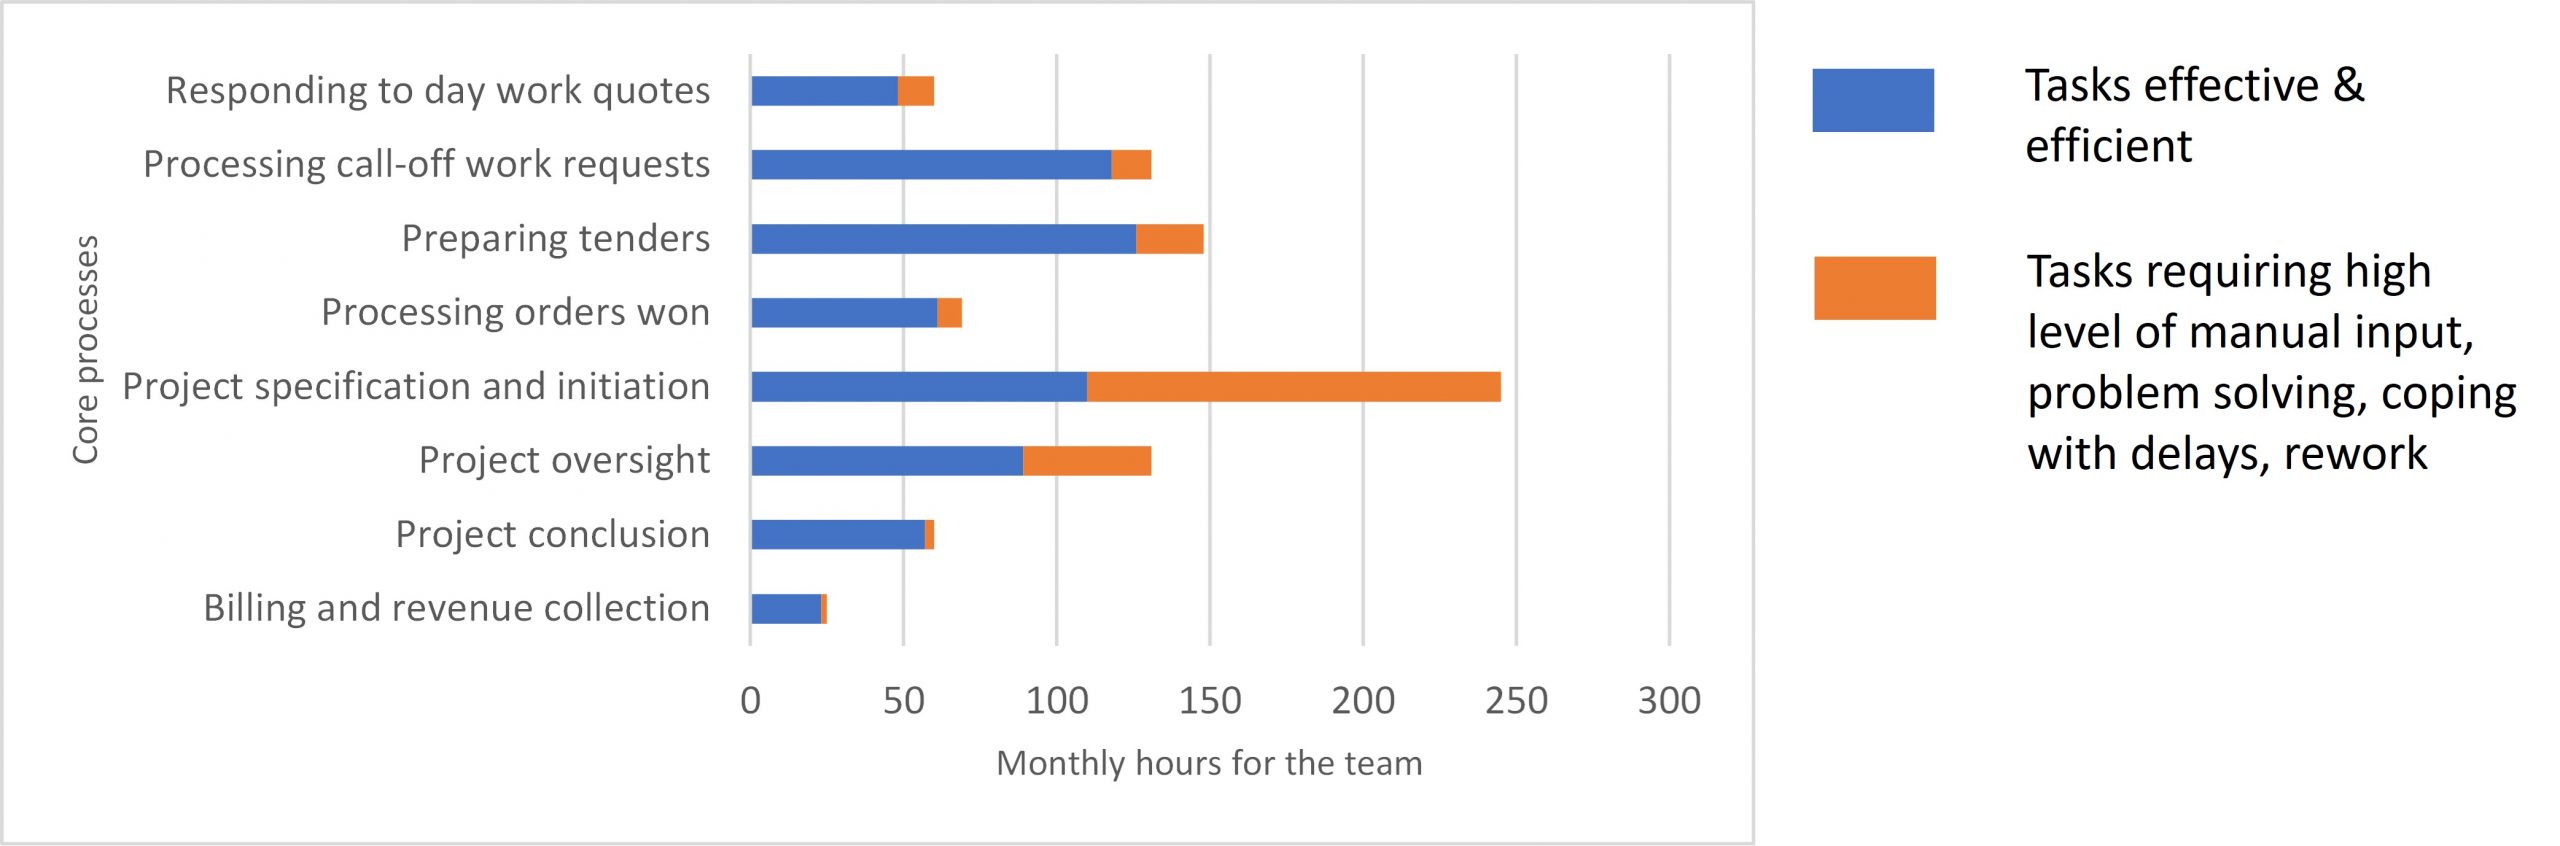
The data presented above is, of course, still the outcome from a series of estimates. But presented this way, it motivated the management team to take action, and provided some big clues about the action needed.
Research then followed into off-the-shelf technology that would remove many of the obstacles to efficient working, and in doing so help to reduce costs, restore profit margins, and improve the number of projects delivered on time.
Spending in ways to help profitability
This allocation and modelling exercise needs to take place no more than once a year – to confirm that things are headed in the right direction.
This is because outcomes take time to be realised, and you learn enough about your costs to be able to get on with building efficient and low cost processes.
You may also have adopted a different mindset when it comes to procurement – one of ‘professional skepticism’.
You will be much more willing to challenge the need for a procurement – how will the expense change the cost of what we do. Is there a corresponding incease in value? If not, then why is the purchase happening?
You will also be more willing to challenge all the terms in a contract – and be prepared to not proceed if the terms in a contract don’t align completely with the way you deliver value to your customers.
And you will be constantly on the look out for ways to purchase that provide you with the greatest number of options at the best possible price – event to the point of seeking services of a procurement expert who can show you the best way to structure a contract and negotiate over the terms.
What’s next
This article barely scratches the surface of a very big subject. There are specialist areas we could delve into e.g. the best sort of Finance System for this sort of analysis, how to go further into ‘Zero Based Budgeting’ to establish the absolute base line for sustainable survival, the vast array of possibilities presented by automation technology.
Its purpose however is to demonstrate that the most powerful weapon against opaque, unnecessary, and inflationary costs is your mindset, along with a small amount of data gathered on an infrequent basis.
The latter will show you what you need to focus upon and care about, and your gritty determination to ask the awkward question and challenge what’s going on will do the rest. The two together sit at the heart of successful cost management.
If you want to gain a greater understanding of the costs in your business and be confident that money spent is driving value, find out more about our professional education course for business leaders – Tracking and analysing cost